The probability of the next word
MATH 3219, Chapter 4. Softmax, and how a raw score becomes a percentage
Chapter 4. The probability of the next word
What you need before this chapter
Here is the honest list. Nothing on it is assumed. Every item links to the exact place in the Math Toolkit where it is taught from zero, and you can follow the link at the moment you hit the symbol rather than reading ahead.
| You will need | Where it is taught | Why this chapter needs it |
|---|---|---|
| A letter standing for a number | Toolkit 1 | The scores are called and the probabilities are called |
| Subscripts, , , | Toolkit 2 | There are 151,936 scores and they need numbering |
| Multiplication, and the sign | Toolkit 3 | Turning a decimal into a percentage is one multiplication |
| The fraction bar as division, and the sign | Toolkit 4 | Softmax is one big division |
| Exponents, including | Toolkit 5 | The whole method turns on raising a number to a power |
| Negative exponents, such as 10-15 | Toolkit 6 | The smallest probability here is written with one |
| The number , and | Toolkit 7 | is the number that does the work here |
| Sigma notation, | Toolkit 10 | “Add up all 151,936 of them” needs a short way to write it |
| Percentages and decimals | Toolkit 11 | A probability of 0.30219 and a probability of 30.219% are the same thing |
| Reading a bar chart | Toolkit 13 | Two figures in this chapter are bar charts |
| Rounding and decimal places | Toolkit 16 | Every worked example here keeps six decimal places, then rounds once |
| Scientific notation | Toolkit 17 | One probability in this chapter is 0.0000000000000051 |
| Inequality signs, and | Toolkit 19 | “No probability is below zero” is written |
| The Greek letters and | Toolkit 20 | Both appear on this page, and both are read out loud by name |
From this book you need two ideas, both one sentence long.
From Chapter 2: a token is a piece of text with a number attached, and the model
works only in those numbers. The word Bakersfield is not one token; it is three pieces,
['B', 'akers', 'field'].
From Chapter 3: a parameter is a learned number stored inside the model. The model in this chapter holds 494,032,768 of them.
You do not need calculus. You do not need to have written code before. You do not need to remember anything from a maths class you took years ago.
Setup
Run this block once. It loads the three tools the rest of the chapter uses and names the two things we will be working with. Every line has a comment saying what it is for.
# os lets Python read and change settings on your computer.
import os

# This says where the downloaded models are kept. It MUST come before the
# transformers line below, because that setting is read once, at import time.
os.environ["HF_HOME"] = r"C:\math3219\models"

# math holds the fixed number e, and math.exp raises e to a power.
import math

# torch is the numerical library the model's arithmetic runs on.
import torch

# AutoTokenizer turns English text into token ids.
# AutoModelForCausalLM loads the model that scores the next token.
from transformers import AutoTokenizer, AutoModelForCausalLM

# The name of the model this whole course uses. It holds 494,032,768 numbers.
model_name = "Qwen/Qwen2.5-0.5B-Instruct"

# The sentence we are going to hand the model.
prompt_text = "The capital of France is"

print("model: ", model_name)
print("prompt:", prompt_text)
model: Qwen/Qwen2.5-0.5B-Instruct
prompt: The capital of France isNothing has happened yet. The model has not been downloaded, the sentence has not been read. Those two lines are the whole output: the names of the two things this chapter is about.
A worksheet in Kern County
Somewhere in Kern County this week, a seventh-grader is filling in a geography worksheet. One of the lines on it reads:
The capital of France is ______
That sentence, with that blank, sits on worksheets, quiz sheets and revision pages all over the web. You are about to see evidence of how often, arriving from an unexpected direction.
Now take the same five words, without the blank, and hand them to a language model. Not a large one. The smallest model in this course, small enough to sit on a student laptop.
The model’s first choice for the next word is Paris, with a probability of 30.219 per
cent (real, from lab/out/we2_softmax.json). That is the answer you expected, and it is
worth noticing that the model is only about 30 per cent sure of it.
The model’s second choice is not a city. It is not Lyon, or Marseille, or France. Its second choice, at 12.315 per cent (real, same file), is:
______
A line of underscores. A blank.
The model has read that worksheet. Not one copy of it, but every copy of it that was on the open web when the model was trained. It learned that after the words “The capital of France is”, a blank is a perfectly normal thing to come next, because in the text it was trained on, a blank very often did come next. Its third and fourth choices, at 6.597 per cent and 5.826 per cent (real, same file), are a colon followed by a new line, which is what you get when the sentence is a heading on a quiz.
This is not a mistake the model is making. It is the training data, sitting in the numbers, where you can read it.
That is what this chapter is really about. A language model hands back a number for every single word it knows, and those numbers are a record of what it read. This chapter teaches you to turn those numbers into percentages you can trust, so that when the model tells you something about the world, you can also ask it how sure it is, and it can answer.
Learning objectives
By the end of this chapter you will be able to:
Explain what a language model actually produces when you give it a sentence, and say why a list of 151,936 scores is not yet a list of probabilities.
Compute softmax by hand on a short list of scores, showing every step, and check your own answer without being told whether it is right.
State the three properties softmax guarantees, namely that every output is positive, that the outputs add to 1, and that the order of the scores is preserved, and justify each one in a sentence.
Use the ratio form, , to compare two candidate words without knowing anything about the other 151,934.
Read a real next-token distribution and say what its shape tells you about the text the model was trained on.
This lesson at a glance
A model scores every word in its vocabulary, not one word. For our model that is 151,936 scores, called logits, ranging from -14.495 to 17.217 (real, from
lab/out/ch04_softmax_chapter.json).Softmax turns those scores into probabilities in two moves: raise to each score, then divide each result by the total of all of them.
Softmax makes three promises and keeps all three: every probability is positive, they add up to 1, and the order never changes.
On the prompt
The capital of France is, the top choiceParistakes 30.219 per cent, the second choice is a fill-in-the-blank line at 12.315 per cent, and the top eight tokens together hold only 72.056 per cent (real, fromlab/out/we2_softmax.jsonandlab/out/ch04_softmax_chapter.json). The rest is spread over 151,928 other tokens.
The vocabulary of this chapter
Every term in this table is defined properly, with a numbered definition, at the point in the chapter where it is first used. The table is here so you can look one up without hunting.
| Term | In one line |
|---|---|
| token | A piece of text with a number attached. Not always a whole word. |
| vocabulary | The complete list of tokens a model knows. Ours has 151,936 entries. |
| next-token prediction | The only thing a language model does: score every token as a candidate for coming next. |
| logit | The raw score the model gives one token. Can be negative. Has no units. |
| the number | A fixed number, , in the same way that is a fixed number. The three dots mean the decimals carry on forever. |
| exponential | The result of raising to a power, written . Always positive. |
| probability distribution | A list of numbers, none below zero, that add up to exactly 1. |
| softmax | The function that turns a list of logits into a probability distribution. |
| the total | The bottom of the softmax fraction: raised to every score, all added together. Also called the normalising constant. |
| probability mass | How much of the total probability of 1 sits on a token or a group of tokens. |
| order preserving | A property of a function: it never changes which item is biggest. |
| temperature | A dial that reshapes the distribution before the probabilities are formed. Chapter 5 is about it; this chapter uses it only in one figure. |
4.1 The model does not pick a word. It scores every word.
Intuition
Ask a friend to finish the sentence “The capital of France is” and they say “Paris”. One word comes out. It feels like a choice: the friend considered the options and settled on one.
Nothing like that happens inside a language model.
The model reads your five words and produces one number for every entry in its dictionary. Not a word. Not a shortlist of three or four good candidates. A number for every single entry, including the ones that make no sense at all.
Our model’s dictionary has 151,936 entries. So the model reads five words and hands back
151,936 numbers. One of those numbers belongs to Paris. One belongs to ______. One
belongs to the string uids, which is a scrap of programming jargon rather than an English
word, and which is in the dictionary because the dictionary was built from raw text off the
internet.
Think of a judging sheet at the Kern County Fair. There are 151,936 pies on the tables, and the judge is required to write a score next to every one of them before leaving the building. The judge does not get to write “Paris” on a slip of paper and go home. The judge writes 151,936 scores. Whichever pie ends up with the highest score is the winner, but the winner is worked out from the sheet afterwards; it is not what the judge produced.
Those scores are called logits, and this is the whole reason the chapter exists. A logit is
a score, and scores are not probabilities. Look at what the model actually returned. The
smallest of the 151,936 scores is -14.495. The largest is 17.217 (real, both from
lab/out/ch04_softmax_chapter.json, fields logit_min and logit_max).
The minus sign in front of -14.495 means that score sits below zero, the way a temperature of minus 14 degrees sits below freezing. A score of -14.495 cannot be a chance of anything. There is no such thing as a negative 14.5 per cent chance. And the scores do not add up to anything in particular; there is no rule saying they should. So the model has given you a complete, detailed opinion, and it has given it to you in units you cannot use. Converting those units is the job of the rest of this chapter.
The mathematics
Start with the three words for the objects involved.
The 151,936 scores get written as a numbered list:
Read that as “z sub one, z sub two, z sub three, and so on up to z sub V”. The subscript is which token, not a power. If subscripts are new, Toolkit 2 starts from nothing.
What we want instead is a list of probabilities, . But “probability” is not a loose word. A list of numbers has to pass two tests before anyone is allowed to call it a list of probabilities.
That pair of conditions is the first formula of the chapter, and it is worth writing out, because everything softmax does is built to satisfy it.
Formula 4.1: What it takes to be a probability distribution
In words. A list of numbers counts as a list of probabilities if two things are true about it. First, not one of them is below zero. Second, when you add them all up, you get exactly one.
The formula.
The symbols.
| Symbol | How to say it out loud | What it means |
|---|---|---|
| “p sub i” | the probability of item number | |
| “eye” | a counter. means the first item, the second, and so on. | |
| “is greater than or equal to” | the thing on the left is either bigger than the thing on the right, or exactly equal to it | |
| 0 | “zero” | the number zero |
| “the sum of”, or “sigma” | add up everything that follows, once for each value the counter takes. See Toolkit 10. | |
| , written under the | “i equals one” | start the counter at 1 |
| , written above the | “vee” | stop the counter at , the size of the vocabulary |
| “equals” | the two sides are the same number | |
| 1 | “one” | the number one, meaning complete certainty spread across the whole list |
Out loud. “Every p sub i is greater than or equal to zero, and the sum from i equals one to V of p sub i equals one.” In plain English: “none of them is negative, and together they add up to one.”
Worked, with numbers made up for practice. Test three candidate lists of three numbers.
Candidate A: . Test one, is any of them negative? 0.42 is positive. 0.31 is positive. 0.27 is positive. Passed. Test two, add them up. The sign is said “plus” and it means add the number on its left to the number on its right. Add two at a time, left to right, so that every line can be checked. Passed. Candidate A is a probability distribution.
Candidate B: . Test one, none is negative. Passed. Test two, add them up. The total is 1.1, not 1. Failed. Candidate B is not a probability distribution. Someone is claiming 110 per cent of the certainty.
Candidate C: . Test two first, add them up. The total is exactly 1, so it passes the second test. But test one fails, because -0.10 is below zero. Candidate C is not a probability distribution. Both tests have to pass.
Check it. The two tests are independent, so check both, every time. A list can add to 1 and still be illegal, as Candidate C shows. If your own list adds to something near 1 but not exactly 1, such as 0.9999 or 1.0001, look first for a rounding slip partway through your arithmetic before you look for a real error.
Now the question the rest of the chapter answers: how do you get from a list of scores that runs from -14.495 to 17.217, to a list that passes both of those tests, without throwing away the model’s opinion?
Python
Load the model, hand it the sentence, and look at what comes back. There are three code blocks here because there are three separate things to see.
First, the model reads the sentence. Text goes in; token ids come out.
# Download (first time only) and load the tokenizer and the model.
tokenizer = AutoTokenizer.from_pretrained(model_name)
language_model = AutoModelForCausalLM.from_pretrained(model_name, dtype=torch.float32)

# eval() tells the model we are using it, not training it.
language_model.eval()

# Turn the sentence into token ids. This is Chapter 2's job, done for us.
prompt_token_ids = tokenizer(prompt_text, return_tensors="pt").input_ids
print("the prompt in token ids:", prompt_token_ids[0].tolist())

# Show which piece of text each id stands for.
for one_token_id in prompt_token_ids[0].tolist():
    print("   id", one_token_id, "is the piece", repr(tokenizer.decode([one_token_id])))

print("vocabulary size:", language_model.config.vocab_size)
the prompt in token ids: [785, 6722, 315, 9625, 374]
id 785 is the piece 'The'
id 6722 is the piece ' capital'
id 315 is the piece ' of'
id 9625 is the piece ' France'
id 374 is the piece ' is'
vocabulary size: 151936Five words became five numbers. Notice the spaces inside the quote marks: the token is
' capital' with a leading space, not 'capital'. The last line confirms the dictionary size,
151,936, which is the number that will appear on top of every in this chapter.
Now run the model and look at the scores.
# torch.no_grad() tells torch we are not training, so it skips the bookkeeping.
with torch.no_grad():
    model_output = language_model(prompt_token_ids)

# The model scores the next token after every position in the prompt.
# We want the last position, which is the one after " is". That is what [0, -1] picks.
next_token_logits = model_output.logits[0, -1]

# %.3f means "print this number with three digits after the decimal point".
print("how many scores came back:", next_token_logits.shape[0])
print("the smallest score is %.3f" % float(next_token_logits.min()))
print("the largest score is  %.3f" % float(next_token_logits.max()))
how many scores came back: 151936
the smallest score is -14.495
the largest score is 17.217That is the whole claim of this section, printed by the machine. One hundred and fifty-one thousand, nine hundred and thirty-six scores. Not a word, not a top three. The smallest is negative, which already rules out reading these as probabilities.
Finally, look at the eight biggest scores and which tokens they belong to.
# torch.topk finds the 8 biggest values and remembers where they were.
top_eight = torch.topk(next_token_logits, 8)

# In the print line below, %d means "a whole number", %-6d means "a whole number
# padded out to six spaces", %-12s means "a piece of text padded out to twelve
# spaces", and %8.4f means "a number with four digits after the decimal point".
# The padding is only there to keep the columns lined up on the screen.
rank_counter = 1
for one_logit, one_token_id in zip(top_eight.values.tolist(), top_eight.indices.tolist()):
    one_token_text = tokenizer.decode([one_token_id])
    print("%d.  id %-6d %-12s logit %8.4f"
          % (rank_counter, one_token_id, repr(one_token_text), one_logit))
    rank_counter = rank_counter + 1
1. id 12095 ' Paris' logit 17.2173
2. id 32671 ' ______' logit 16.3196
3. id 510 ':\n' logit 15.6955
4. id 1447 ':\n\n' logit 15.5711
5. id 1304 ' __' logit 15.3869
6. id 30743 ' ____' logit 15.3036
7. id 7407 ' located' logit 15.2772
8. id 279 ' the' logit 15.0482Read that list slowly, because it is the surprise this chapter is built on. Rank 1 is Paris.
Ranks 2, 5 and 6 are all blanks of different lengths. Ranks 3 and 4 are a colon and a line
break, which is the shape of a heading on a worksheet. Five of the model’s top eight guesses
are not answers to the question at all; they are punctuation from a quiz.
Also look at how close together the scores are. The winner scores 17.2173 and eighth place scores 15.0482. If you drew those two as bars rising from a line at zero, how much taller would the winning bar be? Divide the taller by the shorter:
Two symbols in that line are worth naming before they are used again. The sign is said “divided by”, and it means the same thing as a fraction bar: split the number on the left by the number on the right. Toolkit 4 has both spellings side by side. The sign is said “equals”, and it means the two sides are the same number.
A result of 1.1441 means the first bar is 1.1441 times the height of the second. Take away the 1, because that part is the height they share, and 0.1441 is left over. Multiply by 100 to read it as a percentage: .
Two more symbols there. The sign is said “times”, or “multiplied by”, and Toolkit 3 shows the four different ways this book writes a multiplication. The sign is said “per cent”, and it means “out of a hundred”. Multiplying a decimal by 100 is the whole of the conversion from a decimal to a percentage, and Toolkit 11 works it in both directions.
Back to the bars. The winning bar is about 14 per cent taller than the last one. By eye you could not pick the winner with any confidence. Hold on to that, because in a moment those two tokens will end up at 30.219 per cent and 3.454 per cent. Divide those two the same way:
One of them is nearly nine times the other. The conversion is not cosmetic. It changes what the numbers look like.
One caution about that first calculation, so it does not mislead you later. Drawing the scores as bars from a line at zero is a choice, and Section 4.5 shows that the zero for a logit is not fixed by anything. The “14 per cent taller” is a fact about the picture, not a fact about the model. The “nearly nine times”, worked out from the probabilities, is a fact about the model.
4.2 Step one: make every score positive
Intuition
Two things are wrong with the scores, so fix them one at a time. This section fixes the first one: some scores are negative, and no probability is allowed to be negative.
You need a way to take any number at all, positive, zero or negative, and turn it into a positive number, without changing which ones are bigger than which.
Think about a dimmer switch on a light. Turn it down and the light gets dimmer, and dimmer, and dimmer. It gets very faint. It never goes to actual darkness and it certainly never goes to less than darkness. That is the behaviour you want: a knob you can turn as far down as you like, that always leaves something above zero.
The tool for this is a fixed number called , and an operation called raising to a power.
is a number. It is , and the dots mean the decimals go on forever without repeating, the same way ’s do. The symbol is the Greek letter pi, said “pie”, the one from the area of a circle; Toolkit 20 lists every Greek letter this book uses with its pronunciation. That is all is. It is not a variable standing for something you are supposed to work out, and it is not a typo. It has a letter for the same reason has one: nobody wants to write out 2.718281828459045 every time. For every calculation in this book, is close enough.
Raising to a power is written , said “e to the z”. Your calculator has a key for it,
usually marked e^x, often printed above the ln key, and you may have to press 2nd or
Shift to reach it. Toolkit 7 says exactly where to
find it on a phone, on Windows Calculator, and in Google. A quick test that you found the right
key: type 1, and you should get 2.718282. Type 0, and you should get exactly 1.
The thing that makes the right tool is this. Whatever you feed it, the answer is above zero. Feed it 2 and you get 7.389056. Feed it 0 and you get 1. Feed it -14.495 and you get 0.0000005071, which is tiny, but positive. The light dims and never goes out.
And it keeps the order. A bigger always gives a bigger . So the model’s ranking of the 151,936 tokens survives this step completely intact.
The mathematics
Formula 4.2: Turning a score into a positive number
In words. Take the score and raise the fixed number 2.718282 to that power. Whatever score you started with, what comes out is bigger than zero, and a bigger score always gives a bigger answer.
The formula.
The symbols.
| Symbol | How to say it out loud | What it means |
|---|---|---|
| “a sub i” | the answer for token : the score after it has been made positive. This book calls it the token’s exponential. | |
| “equals” | the two sides are the same number | |
| “e” | the fixed number | |
| “z sub i” | the logit, the raw score the model gave token | |
| the raised position, as in | “to the power of” | a number written small, up and to the right of another, is an exponent. See Toolkit 5. |
| “e to the z sub i” | raise to the power . This is the e^x or exp key on a calculator. | |
| “eye” | which token you are talking about |
Out loud. “a sub i equals e to the z sub i.” In full English: “the exponential of a token is 2.718282 raised to the power of that token’s score.”
Check it. Three tests, in order of usefulness.
is always positive, whatever is. If you get a negative answer, you pressed the wrong key.
exactly and . If your calculator disagrees with either of those, you are on the wrong key. On many calculators
EXPorEEmeans “times ten to the power of”, which is a completely different thing.A bigger must give a bigger . If your answers come out in a different order from your inputs, redo the arithmetic.
One honest note on why and not some other number. Any fixed number bigger than 1 would work for the two jobs described above. Raising 2 to each score would also give positive results and would also keep the order. is chosen for a third reason, which you will see in Section 4.5: with , the difference between two scores turns into exactly the ratio between their two probabilities, with no extra conversion factor. That single property makes the arithmetic clean, and it is why every language model in the world uses here. It is a convenience, not a law of nature, and you should know which it is.
Python
Do the small case first, by machine, and check it against what you worked out on paper.
# The three made-up scores from Worked Example 4.1.
first_score = 2.0
second_score = 1.0
third_score = 0.0

# math.exp(z) is e raised to the power z. Same as the e^x key.
first_exponential = math.exp(first_score)
second_exponential = math.exp(second_score)
third_exponential = math.exp(third_score)

# %.6f means "print six digits after the decimal point".
print("e raised to 2 is %.6f" % first_exponential)
print("e raised to 1 is %.6f" % second_exponential)
print("e raised to 0 is %.6f" % third_exponential)
e raised to 2 is 7.389056
e raised to 1 is 2.718282
e raised to 0 is 1.000000Six digits, identical to the ones you got on the calculator. math.exp(2) is doing exactly
what the e^x key on your phone does, and nothing more.
Three separate variables, three separate lines, no loop. The repetition is on purpose. With three lines you can see each score and its answer sitting next to each other, and you can point at the line that produced any digit on the screen. A shorter version would hide the thing this block exists to show.
Now do the same operation to all 151,936 real scores at once. torch.exp is the same function
as math.exp, with one difference: math.exp takes one number and returns one number, while
torch.exp takes the whole list of 151,936 scores and returns a whole list of 151,936 answers
in a single step. Nothing new is happening mathematically. It is the same key, pressed 151,936
times.
# torch.exp does the same job as math.exp, but to every number in the list at once.
exponentiated_logits = torch.exp(next_token_logits)

# Token id 12095 is ' Paris'. Token id 279 is ' the'. Both from the top-eight table.
print("e raised to the ' Paris' score is %.4f" % float(exponentiated_logits[12095]))
print("e raised to the ' the' score is   %.4f" % float(exponentiated_logits[279]))

# The smallest result in the whole list. This is the negative score, made positive.
print("the smallest of all 151,936 results is %.10f" % float(exponentiated_logits.min()))

# The property that matters: is every single one above zero?
print("is every one of them bigger than zero?", bool((exponentiated_logits > 0).all()))

# The total. Section 4.3 needs this number.
print("all 151,936 of them add up to %.4f" % float(exponentiated_logits.sum()))
e raised to the ' Paris' score is 30017436.0000
e raised to the ' the' score is 3430550.0000
the smallest of all 151,936 results is 0.0000005071
is every one of them bigger than zero? True
all 151,936 of them add up to 99339696.0000Four things to take from that output.
The numbers got very large. A score of 17.2173 became about 30 million, and a score of 15.0482 became about 3.4 million. That is fine. Nothing in this step says the results have to be small, only that they have to be positive. It is also a reminder of how hard pulls the top of a list away from the bottom. Subtract the two scores:
Now divide the two exponentials, which is a different question: not “how far apart are they” but “how many times bigger is one than the other”.
A gap of 2.1691 in the scores has become a factor of nearly nine in the exponentials.
The smallest result is 0.0000005071, which is about five ten-millionths. That came from the lowest score in the vocabulary, -14.495. It is very small and it is above zero. The light dimmed and did not go out.
Every one of the 151,936 results is above zero. That line is the machine confirming the first promise of softmax, not on a made-up example with three numbers in it but on the real distribution with a hundred and fifty thousand.
And the total is about 99.3 million. Hold on to that number. It is going to be the bottom of a fraction in about two pages, and it is the same for every one of the 151,936 tokens.
4.3 Step two: divide by the total. That is softmax.
Intuition
The first problem is fixed. Every number is now positive. The second problem is still there: the numbers add up to about 99.3 million, and they need to add up to 1.
This one has an everyday fix that you have used without calling it anything.
A club at CSUB runs a fundraiser. Three members bring in money: one raises $7.39, one raises $2.72, and one raises $1.00. Someone asks what share of the total each member brought in. You do not need a new idea for this. You add up the total, which is $11.11, and you divide each person’s amount by that total. The first member brought in , which is about 0.665, or about 66.5 per cent of the money. The three shares add up to 1, or to 100 per cent, because every dollar belongs to exactly one member and you counted all the dollars once.
That is the second half of softmax, complete. Add up the exponentials, then divide each one by the total. The result is that token’s share of the whole.
The two halves together have a name.
Softmax is: raise to every score, then divide each result by the total of all of them. That is the entire function. There is nothing else in it. It is one exponentiation and one division, done once for every token in the vocabulary.
The name is worth pulling apart, because it is a bad name and it confuses people. “Max” is in
there because the function does something a little like picking the maximum: the biggest score
ends up with by far the biggest share. “Soft” is in there because it does not pick only the
maximum; it hands out something to everybody, even to uids. A hard max would give the winner
100 per cent and everybody else 0 per cent. Softmax gives the winner the most and leaves the
rest of the list alive.
The mathematics
The total needs a name and a piece of notation, and the notation is the one that stops more readers than any other symbol in this book. So build it in stages.
You want to add up , and , and , and so on, all the way to . Written out in full, that is
The three dots, , are said “and so on”. Four terms are written down; the dots stand for all the ones nobody is going to write out, which is of them. Each one is the same shape as the ones on either side of it. The sign means add, and it keeps going the whole way along.
That is correct and unambiguous. It is also unusable when is 151,936, so there is a shorthand for it, and the shorthand is . If is new, Toolkit 10 builds it from the English sentence “add these up”, in four steps, and takes about ten minutes.
Formula 4.3: The total
In words. Raise to every score in the whole vocabulary, then add all of those results together into one number.
The formula.
The symbols.
| Symbol | How to say it out loud | What it means |
|---|---|---|
| “ess” | the answer: one single number, the total of all the exponentials | |
| “equals” | the two sides are the same number | |
| “the sum of”, or “sigma” | add up everything written to my right, once for each value the counter takes. It is the capital Greek letter sigma, picked because “sigma” starts with the same sound as “sum”. | |
| , written underneath | “j equals one” | the counter is called , and it starts at 1 |
| , written on top | “vee” | the counter stops at , which is 151,936 for our model |
| “jay” | the counter. It takes the value 1, then 2, then 3, and so on up to . | |
| “z sub j” | the score of token number | |
| “e to the z sub j” | the thing being added, once for each |
Out loud. “S equals the sum, from j equals one to V, of e to the z sub j.” In full English: “S is what you get when you raise e to every token’s score and add all of those up.”
Check it. A total has to be at least as big as the largest single item, which is 7.389056, and no bigger than three times that, which is 22.167168. The answer 11.107338 sits inside that range. If your total is smaller than the biggest item on your list, you dropped a term.
Now the division, which finishes the job.
Formula 4.4: Softmax
In words. The probability of a word is raised to that word’s score, divided by the total you get from raising to every word’s score.
The formula.
The symbols.
| Symbol | How to say it out loud | What it means |
|---|---|---|
| “p sub i” | the answer: the probability of token number , a number between 0 and 1 | |
| “equals” | the two sides are the same number | |
| “eye” | which token you are asking about. is the first, the second. | |
| “z sub i” | the logit, the score the model gave token . It can be negative. | |
| “e” | the fixed number | |
| “e to the z sub i” | raise to the power . The top of the fraction. | |
| the raised position | “to the power of” | a small number written up and to the right is an exponent |
| the fraction bar | “divided by” | divide the top by the bottom. See Toolkit 4. |
| “the sum of”, or “sigma” | add up everything that follows, once per value of the counter | |
| underneath the | “j equals one” | start the counter at 1 |
| above the | “vee” | stop the counter at , the vocabulary size, 151,936 for our model |
| “jay” | the counter inside the sum, kept separate from | |
| “z sub j” | the score of token number , as the counter walks through all of them |
Out loud. “The probability of a word is e raised to that word’s score, divided by the sum of e raised to every word’s score.”
Say that sentence out loud once. It is the whole chapter in twenty-three words, and it is worth being able to produce it from memory.
Check it. Add the three probabilities.
They come to exactly 1, so the arithmetic is right. If yours does not come to 1, you divided by the wrong total. Two more checks: no probability came out negative, and the order 2, 1, 0 survived as 0.665, 0.245, 0.090.
Here is that worked example as a picture, which is sometimes the thing that makes it click.
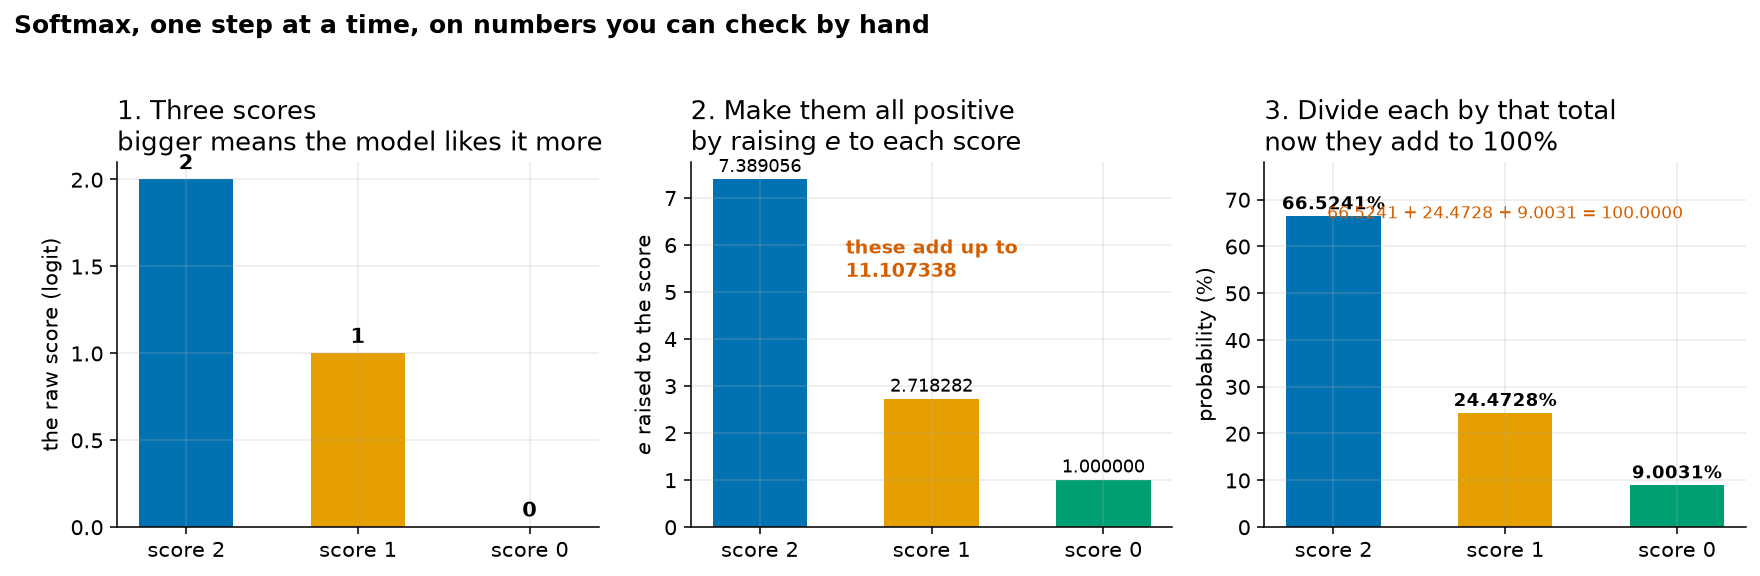
check by hand". The left panel, “1. Three scores”, shows three bars labelled score 2, score 1 and score 0, with heights 2, 1 and 0, evenly spaced. The middle panel, “2. Make them all positive by raising e to each score”, shows the same three labels with heights 7.389056, 2.718282 and 1.000000, no longer evenly spaced, with a note reading “these add up to 11.107338”. The right panel, “3. Divide each by that total, now they add to 100%”, shows the same three labels with heights 66.5241 percent, 24.4728 percent and 9.0031 percent on a vertical axis running from 0 to 78, labelled 66.5241%, 24.4728% and 9.0031%, with a line beneath reading 66.5241 + 24.4728 + 9.0031 = 100.0000. :width: 100%
Softmax as three stages, on the made-up scores 2, 1 and 0. The scores start evenly spaced. After
is raised to each of them, they are no longer evenly spaced, and the leader has pulled away.
After dividing by the total they add to 100 per cent. Produced by lab/fig_extra.py.
Python
Finish the small case first. The exponentials are already in memory from Section 4.2.
# Add the three exponentials. This is the sigma, done by hand for three items.
total_of_exponentials = first_exponential + second_exponential + third_exponential
print("the three results add up to %.6f" % total_of_exponentials)

# Divide each one by that total. Three separate lines, one per token.
first_probability = first_exponential / total_of_exponentials
second_probability = second_exponential / total_of_exponentials
third_probability = third_exponential / total_of_exponentials

print("probability of word 1 is %.6f" % first_probability)
print("probability of word 2 is %.6f" % second_probability)
print("probability of word 3 is %.6f" % third_probability)

# The check from Worked Example 4.3, done by the machine.
print("the three probabilities add up to %.6f"
      % (first_probability + second_probability + third_probability))
the three results add up to 11.107338
probability of word 1 is 0.665241
probability of word 2 is 0.244728
probability of word 3 is 0.090031
the three probabilities add up to 1.000000Six digits, identical to the ones you worked out by hand. That is the point of doing the small case: you now know the machine is doing what you would do, so when it does the same thing 151,936 times you have a reason to believe it.
Now the real thing. torch.softmax does both steps in one call.
# torch.softmax does exactly Formula 4.4 across the whole list at once:
# raise e to every score, add them all up, divide each one by that total.
next_token_probabilities = torch.softmax(next_token_logits, dim=-1)

print("how many probabilities:", next_token_probabilities.shape[0])
print("the largest is  %.6f" % float(next_token_probabilities.max()))
print("the smallest is %.20f" % float(next_token_probabilities.min()))
print("they add up to %.6f" % float(next_token_probabilities.sum()))
how many probabilities: 151936
the largest is 0.302188
the smallest is 0.00000000000000510517
they add up to 1.000062The largest probability is 0.302188, which is the 30.219 per cent for Paris from the opening
of the chapter. The smallest is 0.0000000000000051, which in
scientific notation is about
. It is still above zero, as promised.
That last piece of notation is new, so here is what each part of it does. The 10-15 is read “ten to the minus fifteen”. A minus sign in the raised position means divide rather than multiply, so 10-15 is 1 divided by 1015, which is 1 divided by a 1 with fifteen zeroes after it. Toolkit 6 builds that from upwards. In practice the -15 tells you to move the decimal point fifteen places to the left, so is 0.0000000000000051, which is the number the machine printed.
The last line says 1.000062, not 1. That deserves a straight answer rather than a shrug.
The same rounding, seen a second way
Section 4.2 printed the total of all the exponentials as . The Paris
exponential was . Divide one by the other by hand:
But torch.softmax reported 0.3021884 for the same token. The two answers disagree in the
fifth decimal place.
Neither is wrong on purpose. torch.softmax rearranges the arithmetic before it divides, to
protect against numbers too large for the machine to hold, and that rearrangement rounds
slightly differently from the plain version. Measure the gap between the two answers by
dividing one by the other, keeping seven decimal places so the difference does not vanish in
the rounding:
Take away the 1 and multiply by 100, exactly as in the warning above: , and . That is the same 0.0062 per cent as before. One rounding story, showing up twice. Chapter 6 tells it properly.
Now print the eight biggest probabilities with the tokens they belong to.
# Walk through the eight token ids found earlier and look up each one's probability.
rank_counter = 1
running_total = 0.0
for one_token_id in top_eight.indices.tolist():
    one_token_text = tokenizer.decode([one_token_id])
    one_probability = float(next_token_probabilities[one_token_id])
    running_total = running_total + one_probability
    print("%d.  %-12s %7.3f %%" % (rank_counter, repr(one_token_text), one_probability * 100))
    rank_counter = rank_counter + 1

print("these eight add up to        %7.3f %%" % (running_total * 100))
print("the other 151,928 hold       %7.3f %%" % ((1 - running_total) * 100))
1. ' Paris' 30.219 %
2. ' ______' 12.315 %
3. ':\n' 6.597 %
4. ':\n\n' 5.826 %
5. ' __' 4.846 %
6. ' ____' 4.458 %
7. ' located' 4.342 %
8. ' the' 3.454 %
these eight add up to 72.056 %
the other 151,928 hold 27.944 %Two readings of that table, and the second one matters more.
The first reading is the one you already have. Paris wins with 30.219 per cent, and the
model’s second-favourite continuation is a blank line, at 12.315 per cent.
The second reading is about the shape. Those eight entries are a tiny slice of the dictionary, and it is worth working out how tiny. “Eight out of 151,936” becomes a fraction of one by dividing, and a percentage by then multiplying by 100:
So the eight tokens in that table are 0.005265 per cent of the vocabulary, and they hold 72.056 per cent of the probability. Almost three quarters of the model’s belief sits on eight tokens out of a hundred and fifty thousand. But the remaining 27.944 per cent is real and it is spread across 151,928 other tokens, almost none of which appears in any summary you are likely to be shown. Every “top 5” display you have seen from a language model is hiding a tail like that one.
4.4 The three promises
Intuition
You are going to trust this function a great deal. Every sentence a model writes is softmax run once per word, and by the end of this course you will be making claims about model behaviour that rest entirely on what softmax does. So it is fair to ask what softmax actually guarantees, and to insist that each guarantee comes with a reason rather than a reassurance.
Softmax makes exactly three promises.
First, every output is above zero. No token is ever assigned a negative probability, and no
token is ever assigned exactly zero either. Even uids, which nobody would ever write after
“The capital of France is”, gets a number. It is about five in a thousand trillion, but it is
not nothing. This matters more than it looks: it means a model can always, in principle, produce
any token in its vocabulary. There are no impossible words, only very unlikely ones.
Second, the outputs add up to exactly 1. The model has one unit of belief and it has to
spend all of it. If it becomes more confident about Paris, that confidence has to be taken
from somewhere else in the list. Nothing is created and nothing is thrown away.
Third, and this is the one people miss: softmax never changes the order. Whichever token had the biggest score has the biggest probability. Second biggest score, second biggest probability. All the way down, 151,936 places, with no exceptions and no ties broken differently. Softmax changes the units, not the ranking. It does not have an opinion of its own.
That third promise is the one worth memorising, because a great deal of confused writing about language models comes from not knowing it. Next week you will meet temperature, and you will read, somewhere, that temperature “makes a model more creative”. Temperature works by changing the scores before softmax sees them. It divides every one of the 151,936 scores by the same positive number, written . Dividing a whole list by one positive number does not change which entry is biggest, and softmax then preserves whatever order it is handed, so temperature cannot promote a token above one that was already beating it. Whatever temperature does, it is not that. Chapter 5 does this properly. The reason it will be believable is that you proved the order promise here.
The mathematics
Now the promises, with reasons.
Formula 4.5: Softmax output adds to exactly 1
In words. If you take the softmax probability of every token in the whole vocabulary and add them all together, the answer is one.
The formula.
The symbols.
| Symbol | How to say it out loud | What it means |
|---|---|---|
| “the sum from i equals one to V” | add up the thing on the right, once for every token from the first to the last | |
| “eye” | the counter. It takes the value 1, then 2, then 3, and so on up to . | |
| “vee” | how many tokens are in the vocabulary, 151,936 for our model | |
| “p sub i” | the softmax probability of token | |
| “e” | the fixed number | |
| “z sub i” | the logit, the score the model gave token | |
| “e to the z sub i” | raised to token ’s score, the top of the softmax fraction | |
| “ess” | the total from Formula 4.3, the same number for every token | |
| the fraction bar | “divided by” | divide the top by the bottom |
| “S over S” | a number divided by itself | |
| “equals” | the two sides are the same number | |
| 1 | “one” | the number one |
Out loud. “The sum over all tokens of p sub i equals the sum over all tokens of e to the z sub i, all divided by S, which is S over S, which is one.”
Why it is true, in three sentences. Every one of the fractions has the same bottom, namely . So adding the fractions means adding only their tops, and the tops added together are , which is the definition of . So the sum is divided by , and any number divided by itself is 1.
Worked, with numbers made up for practice. The scores 2, 1 and 0 again.
Step 1, the three tops were 7.389056, 2.718282 and 1.000000.
Step 2, add the tops.
Step 3, that is exactly , which was 11.107338.
Step 4, so the sum of the probabilities is
Check it. The sum of your probabilities is the one check that catches almost every arithmetic slip in this chapter, so do it every time. If your total is bigger than 1, your denominator was too small: you probably left a term out of the sum. If your total is smaller than 1, your denominator was too big, or you dropped a probability when adding. If your total is 1.000062 on a computer rather than exactly 1, see the warning in Section 4.3; that is 32-bit storage, not arithmetic.
The other two promises, and why they hold.
Two of the three arguments below use the symbol , which is new. Formula 4.1 used , said “is greater than or equal to”. The symbol is the strict version: it is said “is greater than”, and it means the thing on the left is bigger than the thing on the right, with equality not allowed. So says “ is bigger than zero”, a stronger claim than , which would also allow to be exactly zero. Toolkit 19 has both signs side by side.
Every probability is above zero. The top of the fraction is , and raised to any power at all is positive. The bottom is , which is a sum of positive numbers and is therefore positive. A positive number divided by a positive number is positive. So for every , no matter how bad the score was.
The order is preserved. Suppose token scored higher than token , so . Raising to a power is order preserving, so . Both are now divided by the same positive number . Dividing two numbers by the same positive number does not change which is bigger. So . The ranking survives, from first place to 151,936th.
That last argument is short enough to reproduce from memory, and it is worth being able to. It is the whole defence against the most common wrong sentence in writing about language models.
Python
The three promises have been argued on paper. Two of them have already been checked by machine. Section 4.2 confirmed that all 151,936 exponentials are above zero. Section 4.3 printed the total as 1.000062, which is 1 to within the limits of 32-bit storage. The third promise, the one about order, has not been checked at all, and it is the one the rest of the course leans on hardest. So check it, on the real distribution, across all 151,936 tokens.
The test needs a little care, and the care is worth explaining. You cannot ask “is the list of
tokens sorted by score the same as the list sorted by probability”, because some tokens in this
vocabulary have exactly equal scores. There are 151,133 distinct values among the 151,936
logits (real, from lab/out/ch04_softmax_chapter.json). Subtract one count from the other,
, so roughly 800 tokens share a score with another token. Equal scores give equal probabilities, and a sorting routine is free to put
two tied items in either order without anything being wrong.
The honest test asks something weaker and more useful. Walk down the tokens from the highest score to the lowest, and ask whether a probability ever goes back up. If softmax preserves order, the answer has to be no, and ties are allowed.
# Sort every token id by its score, biggest score first.
score_order = torch.argsort(next_token_logits, descending=True)

# Line the probabilities up in that same order, then pull them into a plain list.
probabilities_in_score_order = next_token_probabilities[score_order]
probability_list = probabilities_in_score_order.tolist()

# Walk down the list. If softmax preserved the order, each probability
# must be less than or equal to the one before it, all the way down.
a_probability_went_up = False
for position in range(1, len(probability_list)):
    if probability_list[position] > probability_list[position - 1]:
        a_probability_went_up = True

print("walking down all 151,936 tokens, biggest score first:")
print("did a probability ever go back up?", a_probability_went_up)
walking down all 151,936 tokens, biggest score first:
did a probability ever go back up? FalseThree lines in that block are worth reading slowly.
torch.argsort(next_token_logits, descending=True) does not sort the scores. It returns the
token positions, rearranged so that the highest-scoring position comes first. Sorting the
labels rather than the values is what lets the next line line the probabilities up against
the same order.
next_token_probabilities[score_order] then pulls the probabilities out in exactly that order.
After that line, slot 0 holds the probability of the highest-scoring token, slot 1 holds the
second, and so on down to slot 151,935.
The for loop makes one comparison per step, 151,935 of them, and sets
a_probability_went_up to True the first time a probability is bigger than the one before
it. It is written as a plain loop rather than as anything shorter so that you can read the test
and satisfy yourself that it tests the right thing.
The answer is False. In 151,935 comparisons there is not one place where a lower-scoring
token ended up with a higher probability. The argument in the previous part said this could not
happen; the machine agrees that it did not. That is the rhythm this whole course runs on: make
the argument, then measure it, and get suspicious when the two do not meet.
Now look at the shape of the whole distribution, not only the top of it.
# How many tokens are doing any real work here?
tokens_above_one_percent = int((next_token_probabilities > 0.01).sum())
tokens_below_one_in_a_million = int((next_token_probabilities < 0.000001).sum())
print("tokens holding more than 1 per cent:      ", tokens_above_one_percent)
print("tokens holding less than one in a million:", tokens_below_one_in_a_million)

# torch.argmin finds where the smallest value is, which is the model's least favourite token.
least_likely_token_id = int(torch.argmin(next_token_probabilities))
print("the least likely next token is", repr(tokenizer.decode([least_likely_token_id])))
print("its probability is %.20f" % float(next_token_probabilities[least_likely_token_id]))
tokens holding more than 1 per cent: 15
tokens holding less than one in a million: 149355
the least likely next token is 'uids'
its probability is 0.00000000000000510517Read those four lines as a description of a shape.
Fifteen tokens out of 151,936 hold more than one per cent of the probability each. Fifteen. That is where nearly all of the model’s usable opinion lives, and it is the reason a “top 5” display is not as dishonest as it might have sounded a page ago.
At the other end, 149,355 tokens hold less than one chance in a million each. Turn that count into a share of the dictionary the same way as before, by dividing and then multiplying by 100:
That is 98.3 per cent of the vocabulary. So the picture is: a handful of real candidates, a few dozen possible ones, and then a hundred and fifty thousand entries that are present, positive and vanishingly unlikely. That long thin tail holds real probability, 27.944 per cent of it across the tokens outside the top eight, and no display you will ever be shown has room for it.
Distributions of this shape come back in Chapter 5, where you will count how many
tokens it takes to cover 90 per cent of the probability. The letter , said “tee”, is the name
of the temperature dial, and means the dial is in its off position, which is the plain
softmax this chapter has been computing. At the answer is 25 tokens (real, from
_research/00-lab-verified-findings.md, section 2, the distribution-level table).
And the least likely thing the model could say next is 'uids', at about
. A number that small is hard to feel. Turning it into a waiting time
helps, and that needs one small rule of its own.
Formula 4.5a: The average wait for a rare event
This one is lettered rather than given a number of its own, because it is a side tool used once in this chapter. It is not part of the softmax spine. It gets the full six-part treatment anyway, because every formula in this book does.
In words. If something has a fixed chance of happening on each try, then the average number of tries you wait before it happens once is one divided by that chance.
The formula.
The symbols.
| Symbol | How to say it out loud | What it means |
|---|---|---|
| “double-u” | the answer: the average number of tries you wait for one occurrence | |
| “equals” | the two sides are the same number | |
| 1 | “one” | the number one |
| the fraction bar | “divided by” | divide the top by the bottom. See Toolkit 4. |
| “pee” | the chance of the thing happening on any one try, as a number between 0 and 1 |
The here has no subscript on purpose. Everywhere else in this chapter, means the probability of one particular token out of 151,936. In this rule is whatever single probability you are asking about, and the rule works for a coin as happily as for a token.
Out loud. “The average wait is one divided by the probability.”
Worked, on a coin first, then on the real token. Start with a case you can check against life. A fair coin lands heads with probability .
Two tosses on average for one head, which is what a coin does. Now use the full value the
machine printed for 'uids', .
That is about 196 million million, which is 196 trillion.
Check it. A probability is never bigger than 1, so is never smaller than 1. If your answer comes out below 1, you divided the wrong way round. A smaller must give a bigger : halve the probability and the wait doubles.
Now read that answer back as a sentence about the model. You would expect to draw from this
distribution about 196 trillion times before 'uids' came up once. It is not impossible. It is
one hundred and ninety-six trillion to one.
That is what the first promise buys, and it is also why a model can, very occasionally, produce
something that looks like it came from nowhere.
4.5 Scores have no zero point, and the ratio that follows
Intuition
A logit of 17.2173 looks like it should mean something by itself. It does not. Only the gaps between logits mean anything.
Here is the everyday version. Somebody tells you a place is at 400 feet. Four hundred feet above what? Above sea level, which is a line human beings chose. Bakersfield sits at about 400 feet above sea level, and the number would be completely different if we had picked the bottom of the Kern River, or the floor of Death Valley, as the zero. What does not change, whatever zero you pick, is that the Sierra Nevada is higher than Bakersfield, and by how much.
Logits are like that, but with one extra feature: there is no agreed sea level at all. The model never fixes a zero. If you added 1000 to every one of the 151,936 scores, softmax would return exactly the same 151,936 probabilities. Not nearly the same. Exactly the same. So a single logit, quoted on its own, carries no information about how likely a word is. It is only in comparison with other logits that it says anything.
That sounds like a limitation. It is actually a gift, because it means you can compare two
candidate words using only their two scores, and completely ignore the other 151,934. You never
have to compute the 99-million denominator to answer a question like “how much more does the
model want Paris than ______?”
This is also where the choice of pays off. The gap between two scores, run through , comes out as exactly the ratio between their two probabilities. No conversion factor, no fudge. Subtract, exponentiate, done.
The mathematics
Two facts about exponents do the work in this section, and neither has appeared in this book yet. They get the same six-part treatment as everything else, so that nothing further down is taken on trust. They are lettered 4.6a and 4.6b because Formula 4.6, the one this section is really about, is built out of the pair, and you need them first.
Formula 4.6a: Multiplying two exponentials adds their powers
In words. If you multiply raised to one power by raised to another power, you get raised to the two powers added together. Multiplying on the outside becomes adding on the inside.
The formula.
The symbols.
| Symbol | How to say it out loud | What it means |
|---|---|---|
| “e” | the fixed number | |
| “ay” | any number at all, used as a power | |
| “bee” | any other number at all, used as a power | |
| “e to the a” | raise to the power | |
| the raised position | “to the power of” | a number written small, up and to the right, is an exponent. See Toolkit 5. |
| “times”, or “multiplied by” | multiply the number on the left by the number on the right. See Toolkit 3. | |
| “plus” | add the two numbers | |
| “equals” | the two sides are the same number |
Out loud. “e to the a, times e to the b, equals e to the a plus b.”
Worked, with numbers made up for practice. Take and , because you already have both exponentials.
Step 1, the left-hand side. and . Multiply them.
Step 2, the right-hand side. Add the two powers.
Step 3, raise to that.
Check it. The two sides came to 20.085538 and 20.085537. They agree to five decimal places, and the sixth differs only because 7.389056 and 2.718282 were rounded to six places before being multiplied. If your two sides disagree in the first or second decimal place, you have multiplied the powers instead of adding them, which is a different and wrong rule.
Formula 4.6b: Dividing two exponentials subtracts their powers
In words. If you divide raised to one power by raised to another power, you get raised to the first power minus the second. Dividing on the outside becomes subtracting on the inside.
The formula.
The symbols.
| Symbol | How to say it out loud | What it means |
|---|---|---|
| “e” | the fixed number | |
| “ay” | any number at all, used as a power | |
| “bee” | any other number at all, used as a power | |
| “divided by” | divide the number on the left by the number on the right. See Toolkit 4. | |
| “minus” | subtract the number on the right from the number on the left | |
| “a minus b” | the gap between the two powers | |
| “equals” | the two sides are the same number |
Out loud. “e to the a, divided by e to the b, equals e to the a minus b.”
Worked, with numbers made up for practice. The same and .
Step 1, the left-hand side. Divide the two exponentials.
Step 2, the right-hand side. Subtract the two powers.
Step 3, raise to that.
Check it. The same number both ways, 2.718282. This rule is the first one read backwards, because dividing undoes multiplying and subtracting undoes adding. One quick test: if and are the same number, then and , which is right, because any number divided by itself is 1. If you get anything other than 1 in that case, check your subtraction.
Formula 4.6: The ratio form
In words. To find out how many times more likely one word is than another, you do not need the whole vocabulary. Subtract the two scores and raise to the difference.
The formula.
The symbols.
| Symbol | How to say it out loud | What it means |
|---|---|---|
| “p sub i” | the probability of the first word | |
| “p sub j” | the probability of the second word | |
| the fraction bar | “divided by” | divide the top by the bottom. The answer says how many times bigger is than . |
| “equals” | the two sides are the same number | |
| “e” | the fixed number | |
| “z sub i” | the first word’s score | |
| “z sub j” | the second word’s score | |
| “minus” | subtract the number on the right from the number on the left | |
| “z sub i minus z sub j” | the gap between the two scores | |
| the raised position | “to the power of” | raise to everything written up there, gap and all |
Out loud. “The ratio of two probabilities is e raised to the difference between those two words’ scores.”
Why it is true, in two sentences. Both probabilities are fractions with the same bottom, , so when you divide one by the other the cancels and you are left with . Formula 4.6b says that dividing to one power by to another power subtracts the powers, which gives .
Check it. Three tests. If the score on top is the bigger one, your answer must be bigger than 1. If the two scores are equal, the difference is 0, and , so the ratio is exactly 1 and the two words are equally likely. An answer below 1 means you put the lower-scoring word on top and should swap them.
Formula 4.7: Adding the same number to every score changes nothing
In words. If you add the same number to every score in the whole vocabulary before running softmax, every probability comes out exactly as it was. The scores have no fixed zero.
The formula.
The symbols.
| Symbol | How to say it out loud | What it means |
|---|---|---|
| “see” | any fixed number you like, added to every score. It is the same everywhere. | |
| “e” | the fixed number | |
| “eye” | which token you are asking about | |
| “z sub i” | the logit, the score the model gave token , before any shift | |
| “z sub i plus c” | the score of token after the shift | |
| “plus” | add the two numbers | |
| “e to the z sub i plus c” | raised to the shifted score | |
| the raised position | “to the power of” | a number written small, up and to the right, is an exponent |
| “the sum from j equals one to V” | add over every token in the vocabulary | |
| “jay” | the counter inside the sum, kept separate from | |
| “vee” | how many tokens are in the vocabulary, 151,936 for our model | |
| “z sub j” | the score of token number , as the counter walks through all of them | |
| the fraction bar | “divided by” | divide the top by the bottom |
| “p sub i” | the original probability, before any shift | |
| “equals” | the two sides are the same number |
Out loud. “e to the shifted score, divided by the sum of e to every shifted score, equals e to the original score divided by the sum of e to every original score, which is p sub i.”
Why it is true, in three sentences. Formula 4.6a, read right to left, says , so every top gets multiplied by the same number . Every term in the bottom gets multiplied by that same too, so the whole bottom is times what it was. A factor of on the top and a factor of on the bottom cancel, leaving the original fraction.
Check it. Compare with Worked Example 4.3: 0.665241, 0.244728, 0.090031. Identical to all six decimal places. Every intermediate number was about 22,000 times bigger, and the answer did not move at all.
Python
Both of the formulas in this section are claims about the real model, so check both against the real model rather than against a small example.
Start with the ratio form. The block below computes the same quantity twice, by two routes that have almost nothing in common. The first route looks at exactly two numbers, subtracts one from the other, and raises to the result. The second route uses the two probabilities, which were built from all 151,936 scores and a denominator of about 99.3 million. If Formula 4.6 is right, the two routes have to land on the same answer.
# Token id 12095 is ' Paris'. Token id 32671 is ' ______'.
paris_logit = float(next_token_logits[12095])
blank_logit = float(next_token_logits[32671])

# Formula 4.6, the left-hand side: subtract, then exponentiate.
score_gap = paris_logit - blank_logit
print("the ' Paris' score is  %.4f" % paris_logit)
print("the ' ______' score is %.4f" % blank_logit)
print("the gap between them is %.4f" % score_gap)
print("e raised to that gap is %.4f" % math.exp(score_gap))

# Formula 4.6, the right-hand side: the ratio of the two real probabilities.
paris_probability = float(next_token_probabilities[12095])
blank_probability = float(next_token_probabilities[32671])
print("the two probabilities are %.6f and %.6f" % (paris_probability, blank_probability))
print("one divided by the other is %.4f" % (paris_probability / blank_probability))
the ' Paris' score is 17.2173
the ' ______' score is 16.3196
the gap between them is 0.8977
e raised to that gap is 2.4538
the two probabilities are 0.302188 and 0.123149
one divided by the other is 2.4538The two routes give 2.4538 and 2.4538. One of them looked at two numbers. The other looked at all 151,936 of them. They agree to four decimal places, and they agree for the reason the argument gave: the denominator appears on the top and the bottom of the ratio, so it cancels and never has to be computed.
That is a practical result, not only a tidy one. Most tools that expose a model’s internals hand you a top-k list, which is a handful of tokens with their scores. With Formula 4.6 you can answer “how much more does it want this one than that one” from that handful alone. You do not need access to the whole vocabulary, and you do not need the 99.3 million.
Now the shift. This is Formula 4.7, tested by moving every single score in the vocabulary a long way and checking that nothing at all happens to the probabilities.
# Add 1000 to every one of the 151,936 scores. This is c = 1000 in Formula 4.7.
shifted_logits = next_token_logits + 1000.0

# Run softmax again on the shifted scores.
shifted_probabilities = torch.softmax(shifted_logits, dim=-1)

print("the ' Paris' score before the shift: %.4f" % float(next_token_logits[12095]))
print("the ' Paris' score after the shift:  %.4f" % float(shifted_logits[12095]))
print("the ' Paris' probability before: %.6f" % float(next_token_probabilities[12095]))
print("the ' Paris' probability after:  %.6f" % float(shifted_probabilities[12095]))
the ' Paris' score before the shift: 17.2173
the ' Paris' score after the shift: 1017.2173
the ' Paris' probability before: 0.302188
the ' Paris' probability after: 0.302188The score moved from 17.2173 to 1017.2173. How much bigger is that? Divide the new score by the old one:
Nearly sixty times larger. The probability did not move by so much as one part in a million. That is Formula 4.7, on the real model, on the real vocabulary, with .
It is worth noticing what did not happen in that block. Raising to the power 1017.2173
would give a number with 442 digits in front of the decimal point. Chapter 6 shows how to count
the digits of a number that big; for now, take the size on trust and compare it with the size of
the container. The largest number 32-bit storage can hold has 39 digits in front of the decimal
point. A 442-digit number does not fit in a box built for 39 digits, and it never will. If
torch.softmax had followed Formula 4.4 literally, every
intermediate value would have overflowed and the output would have been garbage. It did not,
because torch.softmax quietly subtracts the largest score from every score before it
exponentiates, which by Formula 4.7 changes nothing about the answer and keeps every
intermediate number small. The formula you proved is the reason the library is allowed to do
that. This is also the same rearrangement that produced the fifth-decimal disagreement in the
dropdown back in Section 4.3.
Take the practical lesson from it. If somebody shows you a language model’s logit and tells you the number is large, so the model must be confident, they have told you nothing. A logit on its own is a reading off a ruler with no zero mark. Ask for the gap to the next token, or ask for the probability.
Play with it
The simulation below holds the real numbers from this chapter. Slide it from 0 to 1 to move between the raw logits and the softmax probabilities, and watch the three promises hold while you do it.
Three things to try, in order.
One. Leave the slider at 0 and try to pick the winner by eye. The scores run from 17.2173 down to 15.0482, so the tallest bar is about 14 per cent taller than the shortest, which is the from Section 4.1. Eight bars of nearly the same height do not look like a decision.
Two. Slide to 1. The same eight bars become 30.219 per cent down to 3.454 per cent, and , so the top bar is now almost nine times the bottom one. Nothing about the model’s opinion changed. The units changed.
Three. Watch the readout that says the eight bars add to 72.1 per cent, not to 100 per cent. That is the honest reminder that you are looking at eight rows of a table with 151,936 rows in it.
A first look at temperature
This chapter has used softmax exactly as the model ships it. There is a dial you can put in front of it, called temperature, and Chapter 5 is entirely about it. Here is the figure now so that you have seen the shape before you meet the arithmetic.
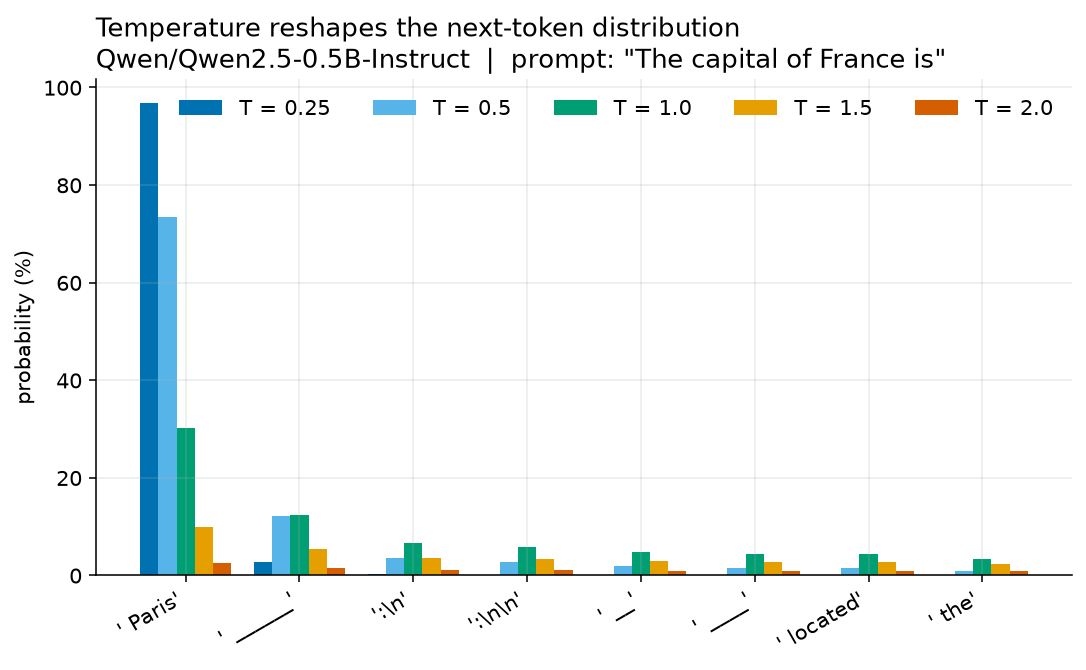
model Qwen2.5-0.5B-Instruct on the prompt “The capital of France is”. The horizontal axis lists eight candidate next tokens, with the token for Paris on the left, followed by a long-underscore token, two colon-and-newline tokens, two shorter underscore tokens, the word located and the word the. The vertical axis is labelled “probability (%)” and runs from 0 to 100 with ticks every 20. Each token has five bars, one per temperature setting, shown in the legend as T = 0.25, 0.5, 1.0, 1.5 and 2.0. The Paris group is by far the tallest, reaching about 97 percent at T = 0.25, falling to about 30 percent at T = 1.0 and to about 2 percent at T = 2.0. Every other group sits below about 13 percent at every temperature. :width: 100%
The probability the model gives each of its top eight next tokens, at five temperature settings.
The middle bar of each group, , is the distribution this chapter computed. Every bar is
real output from Qwen2.5-0.5B-Instruct, from lab/out/we2_softmax.json.
Read only the middle bar of each group for now. That is , which is what plain softmax gives, and it is the 30.219, 12.315, 6.597 and so on that you worked with above.
Then look across one group. At the Paris bar reaches 96.799 per cent. At
it has fallen to 2.447 per cent (real, both from lab/out/we2_softmax.json). The
scores never changed. Only the dial moved.
Common mistakes
These are the eight things that actually go wrong, in rough order of how often.
Dividing before exponentiating. The order is: raise to each score first, then add, then divide. Doing the division first gives a different answer and there is no way to recover. How to spot it: your probabilities will not add to 1.
Reading as . That would be 5.436564. The right answer is 7.389056. How to spot it: check that and on your calculator before you trust the key.
Running softmax on only the top few scores. If you softmax the eight logits in the top-eight table instead of all 151,936, you get
Parisat 41.9379 per cent instead of 30.219 per cent (real, both fromlab/out/ch04_softmax_chapter.json, where the wrong number is recorded alongside the right one). Both are correct arithmetic. Only one answers the question “what will the model say next”, because the model’s real choice includes the other 151,928 tokens. How to spot it: your top probability is too high and your numbers add to 1 over a list that is plainly incomplete.Treating a logit as a probability. A logit of 17.2173 is not 17 per cent, and it is not 1,721.73 per cent either. It is a score on a scale with no zero. How to spot it: if any of your “probabilities” is above 1 or below 0, you skipped softmax.
Rounding partway through. Round to 7.4 before adding and the total becomes 11.118282 instead of 11.107338, which turns 66.5241 per cent into 66.5570 per cent. Keep six decimal places until the final line, then round once. How to spot it: your answers sit close to the book’s and disagree from the fourth decimal place onwards.
Believing softmax can change the winner. It cannot. If your computed probabilities put a lower-scoring token above a higher-scoring one, you have made an arithmetic error, and there is no need to look for anything more interesting than that. How to spot it: sort your scores and your probabilities and check that the two orders match.
Expecting a computer to print exactly 1. It printed 1.000062 here. The mathematics is exact; 32-bit storage is not. See the warning in Section 4.3 and all of Chapter 6. How to spot it: an error small enough to live in the fifth decimal place is storage; an error in the first or second decimal place is you.
Reading a very small probability as zero. The token
'uids'sits at about , which is not zero and never will be. As mathematics, softmax cannot output zero. As arithmetic on a real machine it sometimes prints one, because a number too small for 32-bit storage to hold gets stored as zero, which is Chapter 6’s subject. In this chapter’s distribution that never happens: the smallest of the 151,936 probabilities is , comfortably inside what 32 bits can hold. How to spot it: if you have written 0 as a probability by hand, you have rounded something that should have been kept.
What to remember
Five sentences. If you keep only these, you have the chapter.
A language model does not choose a word; it gives a score, called a logit, to every one of the 151,936 tokens in its vocabulary.
Softmax turns those scores into probabilities in two moves: raise to every score, then divide each result by the total.
Softmax always keeps three promises: every probability is positive, they add to 1, and the order never changes.
Only the gaps between logits carry information, so one logit on its own tells you nothing.
On the prompt
The capital of France is,Parisgets 30.219 per cent and a fill-in-the-blank line gets 12.315 per cent, which is a record of what the model read.
Practice problems
Answers to the odd-numbered problems are in the Answers appendix. Try each problem all the way to a number before you look. Keep six decimal places until the last line, then round once, which is what Toolkit 16 means by rounding once at the end.
Every problem whose numbers are described as made up for practice uses invented scores,
chosen to be checkable on a phone. Every problem marked real uses numbers from
lab/out/we2_softmax.json or lab/out/ch04_softmax_chapter.json. You can open both. A problem
carrying neither label is either pure arithmetic on , which needs no source, or it reuses a
list you have already met on this page under one of those two labels.
Warm-up: can you do the arithmetic?
Work out to six decimal places.
Work out to six decimal places. Is your answer positive?
Without touching a calculator, write down , and write one sentence saying why it has that value.
Made up for practice. Two tokens have scores 2 and 0. Raise to each, add the two results, then divide each result by the total. Show every step, and check that your two answers add to 1.
Made up for practice. Three tokens have scores 1, 0 and 0. Work out all three probabilities, showing every step, and check that they add to 1.
Does the list pass both tests in Formula 4.1? Show both tests.
Does the list pass both tests in Formula 4.1? If not, say which test it fails and by how much.
Does the list pass both tests in Formula 4.1? Careful: it passes one of them.
Write the probability 0.665241 as a percentage.
Real. Write the percentage , which is the model’s probability for
Paris, as a decimal.
Practice: can you apply it?
Made up for practice. Work out softmax on the scores 3, 2 and 1. Compare your three answers with the ones from the scores 2, 1 and 0 in Worked Example 4.3. Explain in one sentence why they came out the way they did.
Made up for practice. Work out softmax on the scores 0, -1 and -2. All three scores are zero or negative. Are any of your probabilities negative? Explain why not, in one sentence.
Made up for practice. Work out softmax on the scores 4, 2 and 0, showing every step.
Made up for practice. Three tokens all have the score 4. Work out all three probabilities without doing any exponentials, and say how you knew.
Made up for practice. Four tokens all have the score 10. Work out all four probabilities.
Real. The logit for
Parisis 17.2173 and the logit fortheis 15.0482. Use Formula 4.6 to find how many times more likelyParisis. Then check your answer against the recorded probabilities, 0.302188 and 0.034536.Real. The top eight tokens hold 72.056 per cent of the probability. How much is left, and across how many tokens is it spread? Write one sentence on what that tells you about reading a “top 5” display.
Made up for practice. Two tokens have scores -5 and -6. Work out both probabilities. Then compare your answers with the scores 1 and 0 from Try it 4.1. Explain the result using Formula 4.7.
A classmate raises one token’s score by 1 and leaves every other score in the vocabulary alone. Does that token’s probability go up, go down, or stay the same? Answer in one sentence and name the formula that settles it.
Real. The model’s least likely next token is
'uids', at about . Explain, in two sentences, why softmax can never assign it exactly zero.
Stretch: can you reason with it?
Show, using Formula 4.6a, , that adding the same number to every score leaves every softmax probability unchanged. Write it out for a vocabulary of three tokens, with every step visible.
Explain in your own words why softmax can never return exactly 0, and why it can never return exactly 1 when the vocabulary has more than one token. Two short paragraphs.
Real. The top eight tokens are 0.005265 per cent of the vocabulary and they hold 72.056 per cent of the probability mass. Write two sentences on what that says about how confident this model is, and two more on what it does not say.
Real. A student runs softmax on only the eight logits in the top-eight table and gets
Parisat 41.9379 per cent instead of 30.219 per cent. The arithmetic is correct in both cases. Explain what changed, and which number answers the question “what will the model say next?”Real. The computer printed the sum of all 151,936 probabilities as 1.000062, while Formula 4.5 proves the sum is exactly 1. Which one is wrong, and what does the size of the gap, 0.0062 per cent, tell you about where the error came from?
Real. If you drew one token at random from this distribution once a second, about how long would you expect to wait before
'uids'came up, given its probability of about ? Use Formula 4.5a to get the number of draws first, then turn draws into years. Give your answer in years and show the arithmetic. One year is about 31,557,600 seconds.Real. The model’s second, third, fourth, fifth and sixth choices are
______,':\n',':\n\n',__and____, holding 12.315, 6.597, 5.826, 4.846 and 4.458 per cent. Add those five together. Then write a short paragraph arguing either that this model has misunderstood the question, or that it has understood a different question perfectly well. Use at least two numbers from this chapter to support whichever case you make.
Where this goes next
Chapter 5 puts a dial in front of softmax and measures what turning it does. The scores never change; the probabilities change a great deal. You will be able to say exactly what temperature does, and exactly what it cannot do, because you proved the order promise here.
The formula summary for this chapter, with the same six-part treatment and a few extra entries, is at Softmax in the formula appendix. Every term defined here also appears in the glossary.